Do you have a Drupal website with a lot of traffic? Then you might know how it feels when you have to debug a problem and you find out that the period you are looking for is no longer available in the Recent Logs messages menu.
One of our clients, whose website is powered by Drupal and serves ~500.000/requests per day, has tasked us to keep a history of these logs, so issues can be tracked, quantified and displayed in a more visual friendly way.
OS used in this scenario: Ubuntu Server
Software needed: ElasticSearch, Logstash, drupal_dblog plugin, Kibana
Infrastructure scenario: 1 web server (192.168.1.10), 1 database server (192.168.1.99).
All required software will be installed on the web server.
When downloading ElasticSearch, Logstash and Kibana, choose versions which have release dates relatively close to each other. Take note that just using the latest versions of each software might not work, and combining different major versions is surely to cause problems.
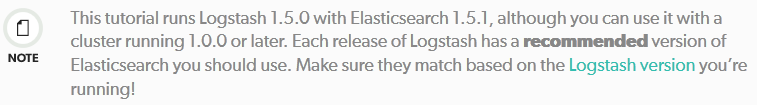
https://www.elastic.co/guide/en/logstash/current/getting-started-with-logstash.html
We ended up using the following versions:
elasticsearch-1.5.0
logstash-1.5.1
kibana-4.0.1-linux-x64
apt-get install -y openjdk-7-jdk openjdk-7-jre openjdk-7-jre-headless


wget https://download.elastic.co/elasticsearch/elasticsearch/elasticsearch-1.5.0.tar.gz -O /usr/src/elasticsearch-1.5.0.tar.gz

wget //download.elastic.co/logstash/logstash/logstash-1.5.1.tar.gz -O /usr/src/logstash-1.5.1.tar.gz

wget https://download.elastic.co/kibana/kibana/kibana-4.0.1-linux-x64.tar.gz -O /usr/src/kibana-4.0.1-linux-x64.tar.gz

cd /opt

tar -xzf /usr/src/elasticsearch-1.5.0.tar.gz

tar -xzf/usr/src/logstash-1.5.1.tar.gz

tar -xzf /usr/src/kibana-4.0.1-linux-x64.tar.gz
ELASTICSEARCH
Add/change the following in elasticsearch-1.5.0/config/elasticsearch.yml: network.host: 127.0.0.1
Start ElasticSearch with /opt/elasticsearch-1.5.0/bin/elasticsearch > /dev/null 2>&1 &
LOGSTASH
Install logstash-input-drupal_dblog, which automatically retrieves events from the watchdog mysql table: logstash-1.5.1/bin/plugin install logstash-input-drupal_dblog
Assign limited mysql privileges to Logstash, don’t just connect with root! Logstash only needs access to the watchdog and variable tables.
mysql> grant SELECT on yourdb.watchdog to 'logstashusr'@'192.168.1.10' IDENTIFIED BY 'somepassw';

mysql> grant SELECT,INSERT,UPDATE on yourdb.variable to 'logstashusr'@'192.168.1.10';
Add the following in logstash-1.5.1/logstash.conf:
input {

        drupal_dblog {

                databases => [ "your-site", "mysql://logstashusr:[email protected]/yourdb" ]

                interval => 1

        }

}


output {

        elasticsearch {

                host => "localhost"

        }

}
interval => 1 means Logstash will poll your database every minute.
Start Logstash with /opt/logstash-1.5.1/bin/logstash -f /opt/logstash-1.5.1/logstash.conf – if there is no error, also add > /dev/null 2>&1 &
If you get the dreaded cannot load Java class com.mysql.jdbc.Driver, then
vim logstash-1.5.1/vendor/bundle/jruby/1.9/gems/logstash-input-drupal_dblog-0.1.7-java/lib/logstash/inputs/drupal_dblog.rb, and right after the first set of requires, add: require "/opt/logstash-1.5.1/vendor/bundle/jruby/1.9/gems/jdbc-mysql-5.1.35/lib/mysql-connector-java-5.1.35-bin.jar"
Then start Logstash again. (documented here).
Wait some time and then do a curl http://localhost:9200/_search?pretty. It should return the first ten results indexed in ElasticSearch, confirming Logstash is successfully inserting events. Add &size=100 to the curl request to get more events.
KIBANA
Generate a self-signed (or use a valid one) SSL certificate for HTTPS:
openssl req -x509 -nodes -days 3650 -newkey rsa:2048 -sha256 -keyout kibana.key -out kibana.crt

cat kibana.crt kibana.key > /etc/ssl/private/kibana.pem

chmod 400 /etc/ssl/private/kibana.pem
In kibana-4.0.1-linux-x64/config/kibana.yml, add/change:
ssl_key_file: /etc/ssl/private/kibana.pem

ssl_cert_file: /etc/ssl/private/kibana.pem
For user authentication in Kibana, you must reconfigure ElasticSearch and Logstash – read the docs #1 #2 #3.
You can also choose to configure a reverse proxy to handle authentication, like Haproxy, Nginx, Varnish or Apache. We decided to handle HTTPS and authentication from Nginx because it was already on the server, in which case the following can be used in the server config block:
location / {

        auth_basic "private";

        auth_basic_user_file /etc/nginx/htpasswd;

        proxy_pass http://127.0.0.1:5601;

        proxy_set_header Host $host;

        proxy_set_header  X-Forwarded-For $proxy_add_x_forwarded_for; }


ssl on;

ssl_certificate /etc/ssl/private/kibana.pem;

ssl_certificate_key /etc/ssl/private/kibana.pem;

ssl_protocols TLSv1.1 TLSv1.2;

ssl_ciphers 'HIGH:!aNULL:!eNULL:!NULL:!LOW:!EXPORT:!DES:!MD5:!PSK:!EXP:!SRP:!DSS:!DH:!RC4';

ssl_prefer_server_ciphers on;
If you need to access Kibana on a subdomain, say example.com/kibana, then use the following for the location block:
location ~* /kibana/.* {

        auth_basic "private";

        auth_basic_user_file /etc/nginx/htpasswd;

        rewrite ^/kibana/(.*) /$1 break;

        proxy_pass http://127.0.0.1:5601;

        proxy_set_header Host $host;

        proxy_set_header  X-Forwarded-For $proxy_add_x_forwarded_for; }
Start Kibana with /opt/kibana-4.0.1-linux-x64/bin/kibana > /dev/null 2>&1 &
To connect to the Kibana dashboard, access the web server in your browser: https://192.168.1.10:5601
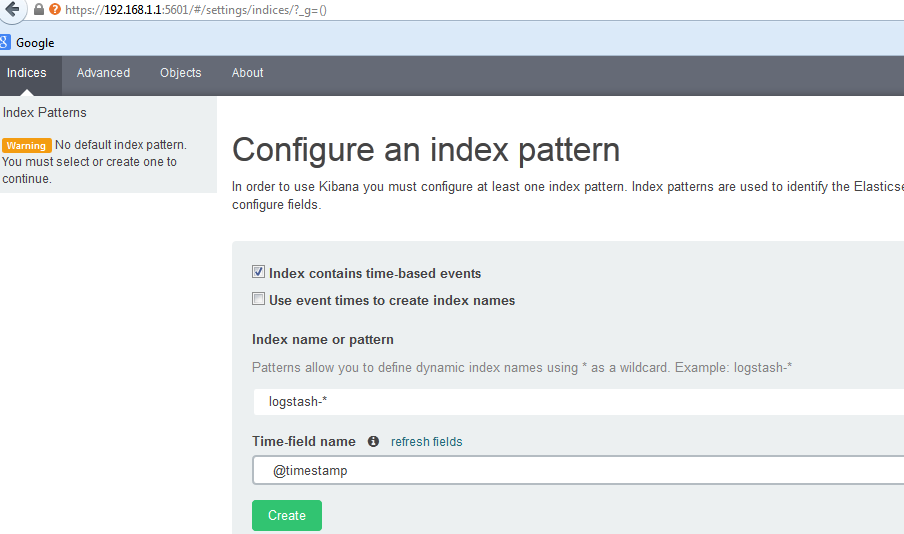
You should be presented with a page in which you have to define an index name, so it can know where to look when you make a search. The default, Index name logstash-* with Time-field name @timestamp will work.
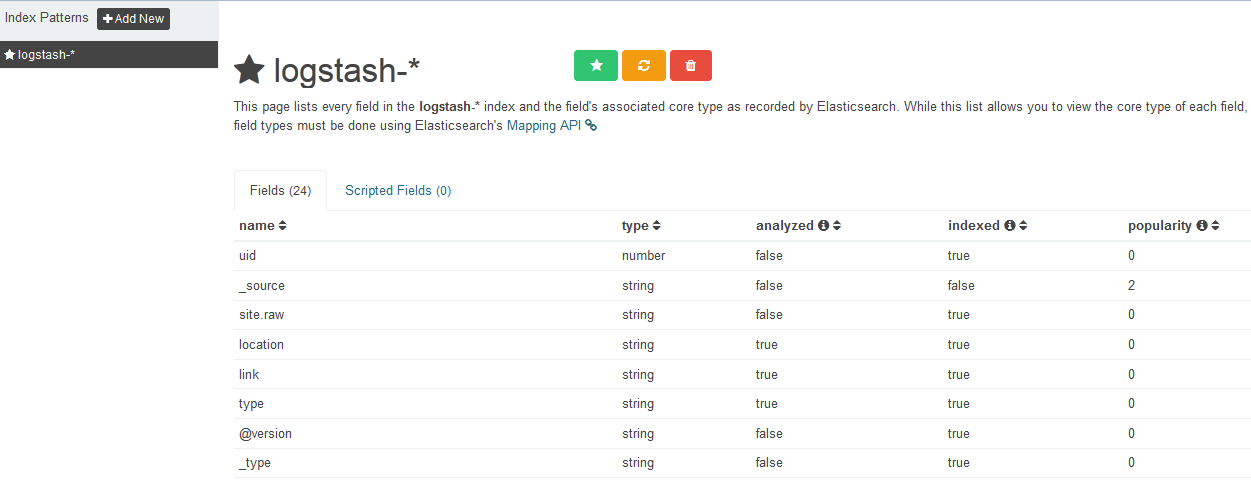
You should see a list of available field names.
Now you can head to the Discover page and start searching. Also make note of the upper right button where you can select the time frame.
Also be sure to check out the Visualize menu.
To automatically start them up at reboot, either create an init script for each service or add them in /etc/rc.local.
If everything is working as expected, consider running each application with its own user, rather than using root.